Services for utility companies
Are you part of a utility company and looking for solutions to optimize data management and energy supply?
Center Denmark offers a variety of services to Danish utility companies that are designed to provide access to, process, refine and analyse utility data. Through our expertise, our services support utility companies with advanced data and analytics technologies.
Read more about:
- The data infrastructure
- API-integration
- Dashboards
- The energy map
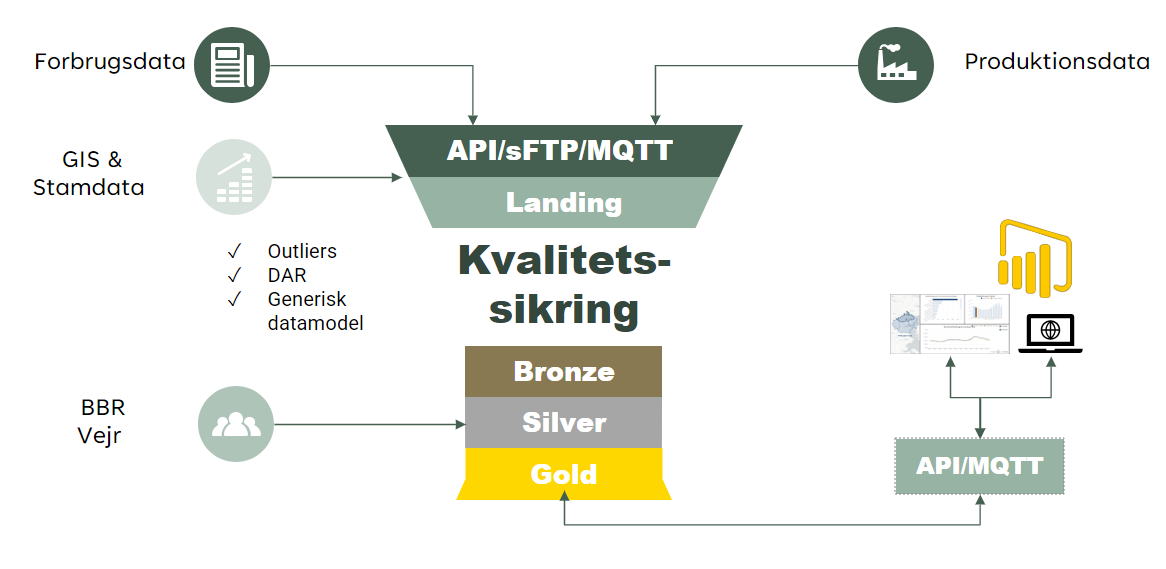
Our Data Infrastructure
API-integration
Center Denmark offers various options for API access, providing utility companies with in-depth technical insights into their own cleansed and enriched data. By using business intelligence tools, companies can leverage this data to enhance their analyses and decision-making.
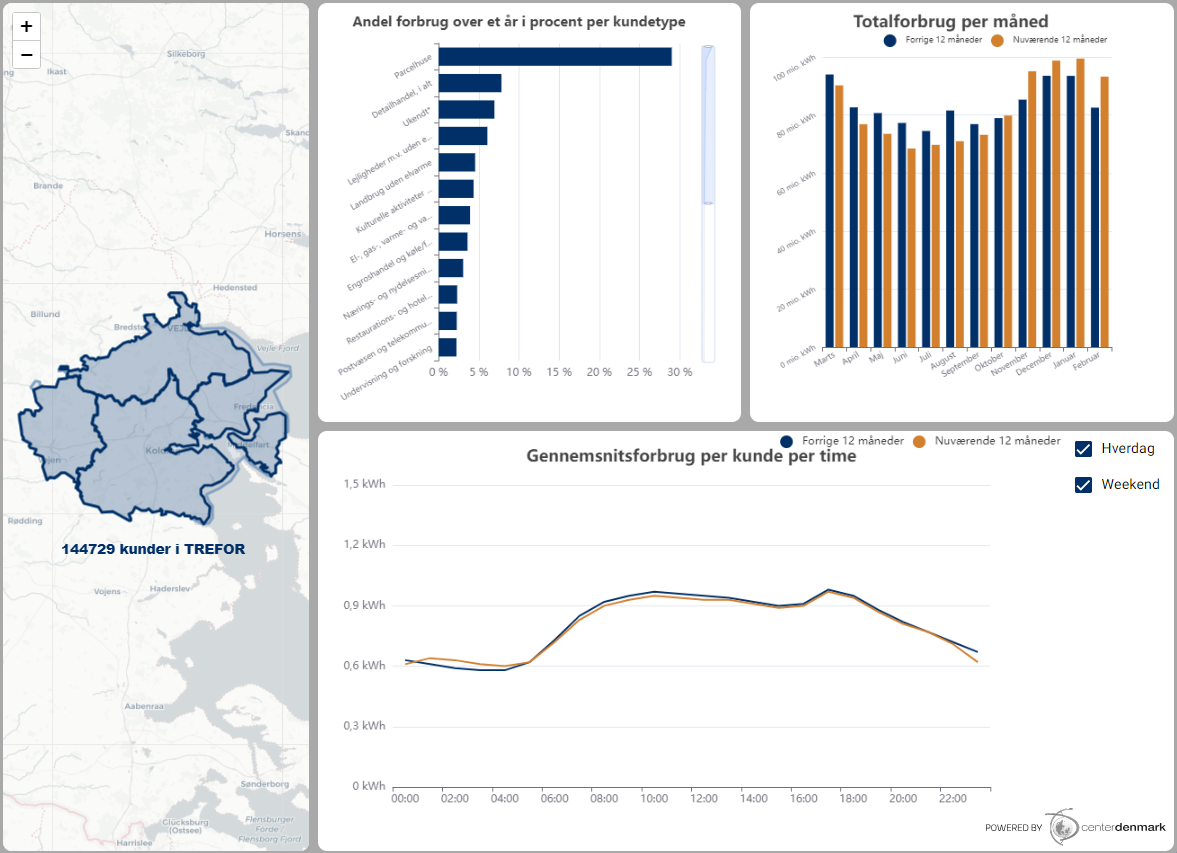
Dashboards from district heating and electricity
Center Denmark has developed interactive dashboards that provide detailed visual overviews of specific geographical areas at any given time.
Our dashboards offer insights into consumption patterns, helping to optimize utility operations and plan expansions. They display data on district heating, electricity, grid load, and connections, which are essential for efficient operations and sustainable energy use.

The energy map - the visual energy tool
Our energy map is a visual tool that illustrates the dynamics of Denmark's energy supply, covering electricity, district heating, gas, water supply, and Power-to-X. It also provides insights into planned expansions or changes in the grid.
The energy map's insights are available to citizens, utility companies, businesses, and authorities. In the near future, it will also enable tracking of the CO2 emissions accounts of Danish municipalities.
Learn more about the energy map here: